


This piece is about a study published this July in JAMA, which followed 2,684 cognitively healthy older adults, some with barely a trace of Alzheimer’s-related brain changes, others with substantial buildup, for up to 13 years. Its focused question: what does an elevated blood marker called p-tau217 actually predict about who goes on to develop memory problems, and by how much?
The short version: landing in the highest p-tau217 group is an important finding, and it’s also, like most things in medicine, probabilistic rather than deterministic. It meaningfully shifts the odds of decline. It does not function like a positive or negative diagnostic result, and it does not tell a person what their future holds. Most people in that highest group, in every dataset discussed below, did not go on to develop dementia within the years these studies were able to follow them. That distinction, informative versus determinative, is the throughline of everything that follows. (More on how to weigh that balance, with a real-world comparison, at the end.) Today, p-tau217’s clearest use is identifying good candidates for prevention trials, replacing expensive and complex PET scans; but it is not yet ready for clinical use, and current guidelines recommend against using it to screen healthy people outside of research.
What does p-tau217 actually measure?
p-tau217 is a small piece of tau protein that leaks out of brain cells into blood. Its release is triggered mostly by amyloid, the sticky protein plaques that build up early in Alzheimer’s disease. So for most of its range, a rising p-tau217 mainly means “more amyloid,” not “more tau tangles.” Only later in the disease does it start reflecting actual tau buildup too, the kind seen on a specialized brain scan called a tau PET. That scan lights up wherever tangled tau protein has physically accumulated inside neurons; tau doesn’t spread evenly, it tends to start in one small area and then move into connected regions over time, the way an outbreak spreads along a transit line rather than raining down on a whole city at once.
Three more things are worth knowing in plain terms. A Centiloid is just a 0-to-100-plus scale for how much amyloid shows up on a brain scan, built so different scanners and tracers can be compared fairly; 0 is a young, healthy brain, 100 is roughly what’s typical in mild-to-moderate Alzheimer’s dementia. Harmonizing means converting each lab’s raw number onto a shared scale (usually “how many standard deviations from average”), since different test brands don’t report the same raw numbers for the same biology. And logistic regression, a term that shows up later, is simply the standard math for turning a measurement into a probability, like “what’s the chance this person’s tau has started accelerating,” producing a curve rather than a hard yes/no line.
How results get labeled, and why that label isn’t the whole story
One widely used commercial test (Lumipulse, made by Fujirebio) sorts results into three bands:
Category Lumipulse p-tau217 (pg/mL) Interpretation Negative ≤ 0.18–0.20 Alzheimer’s-type pathology unlikely Indeterminate / gray zone 0.18–0.32 Borderline; further evaluation recommended Positive ≥ 0.32–0.33 High probability of Alzheimer’s-type pathology
What these numbers actually mean: these specific cutoffs were derived by comparing symptomatic memory-clinic patients with confirmed Alzheimer’s pathology (via PET scan or spinal fluid) against those without it. They mark where, in that particular symptomatic population, the test best tells the two groups apart, not a universal biological line in the sand. Other manufacturers (Eli Lilly, Roche Elecsys, C2N, and others) use different chemistry and validate their own, different pg/mL cutoffs. There is no single, agreed-upon p-tau217 cutoff across labs today. That lack of a uniform cutoff is one of the main reasons this test cannot yet support a specific clinical recommendation, and it’s worth remembering as a take-home point on its own.
Just as important regardless of which band a result falls in: no p-tau217 result should replace an actual cognitive evaluation. A “low” number doesn’t mean skip a checkup if something feels off, and a “high” number doesn’t mean a diagnosis has been made. The blood test is one input, not a verdict, and it hasn’t been validated for screening healthy people outside of research studies.
Research studies mostly sidestep these fixed bands. Instead they rank people against each other, low, intermediate, high, “very high,” based on their own study population. So “very high” in a study (roughly the top fifth of people, corresponding to substantial amyloid buildup on a brain scan) is a relative ranking within that study, not a number you could match against a personal lab report using the commercial bands above.
The JAMA study: what nearly 2,700 people showed
This study pooled six research groups (ADNI, the A4 and LEARN studies, Harvard Aging Brain Study, Wisconsin Registry for Alzheimer’s Prevention, and HABS-HD), for 2,684 cognitively healthy older adults followed a median of about 5.4 years, up to 13.5 years. Everyone had both a blood test and a brain amyloid scan at the start.
One term needs defining clearly: “progression.” Here it meant reaching a diagnosis of mild cognitive impairment (MCI), dementia, or two consecutive visits showing very mild impairment on a standard staging scale. A separate, second measure tracked gradual decline on cognitive testing, without requiring a formal diagnosis; it told the same story.
The results, in plain numbers:
Low or intermediate p-tau217 (roughly under 25 Centiloids of amyloid): just a 12–15% chance of progressing over 5 years. Genuinely reassuring.
High p-tau217: 24% over 5 years, 62% over 10.
Very high p-tau217 (roughly the top fifth, over 60 Centiloids): 38% over 5 years, 78% over 10, about four times the lowest group’s risk.
Here’s the point worth sitting with: even in that highest-risk group, nearly two-thirds had not progressed after 5 years, and even at 10 years, about 1 in 5 still hadn’t. A high result shifts the odds substantially. It doesn’t seal anyone’s fate.
Some honest limits: these six groups were mostly white, well-educated research volunteers, not a random slice of the public, so results may not generalize perfectly. The four risk groups also overlap somewhat rather than being sharply distinct categories, deaths weren’t tracked as a competing outcome, and only 5% of people were followed past 10 years, so the longest-term numbers are least certain. Risk also ran a bit higher in men and older participants at the same p-tau217 level, a reminder that one number doesn’t mean the same thing for everyone.
A quick note on sources, because three different tools appear in this piece and they shouldn’t be treated as one. The JAMA study above used its own six research groups and its own definition of progression. A separate paper from the Mayo Clinic Study of Aging, cited by the JAMA authors, used a different measure (brain amyloid scans rather than blood tests) to estimate risk specifically of MCI. And the Mayo calculator used below is a third, distinct tool, built on blood p-tau217, projecting decades into the future using its own statistical model. All three are useful. None of their numbers should be lined up against each other as if they were measuring the exact same thing.
Seeing it with real amyloid numbers
A related analysis (from the A4 and LEARN studies) split people into thirds by p-tau217 and matched each third to actual brain amyloid levels: roughly 47, 61, and 84 Centiloids for the low, middle, and top thirds. The top third showed a clearly steeper rise in confirmed decline over six years than the bottom third, whose amyloid levels averaged only about 4 Centiloids.
A worked example: the Mayo calculator
The Mayo Clinic Study of Aging built a public tool (the Mayo CACR calculator) that turns an actual p-tau217 number, plus age, sex, and genetics, into a personalized curve. It’s a different, separate model from the JAMA study above, using its own long-term projections, so treat the two as complementary rather than directly interchangeable; its multi-decade curves are computed projections, not observed follow-up. Readers curious to see how the numbers shift for a different age, sex, or p-tau217 value can try it directly at the link above.
Running it for a 60-year-old woman carrying the APOE4 gene (more on that below), at three “positive-range” p-tau217 values:
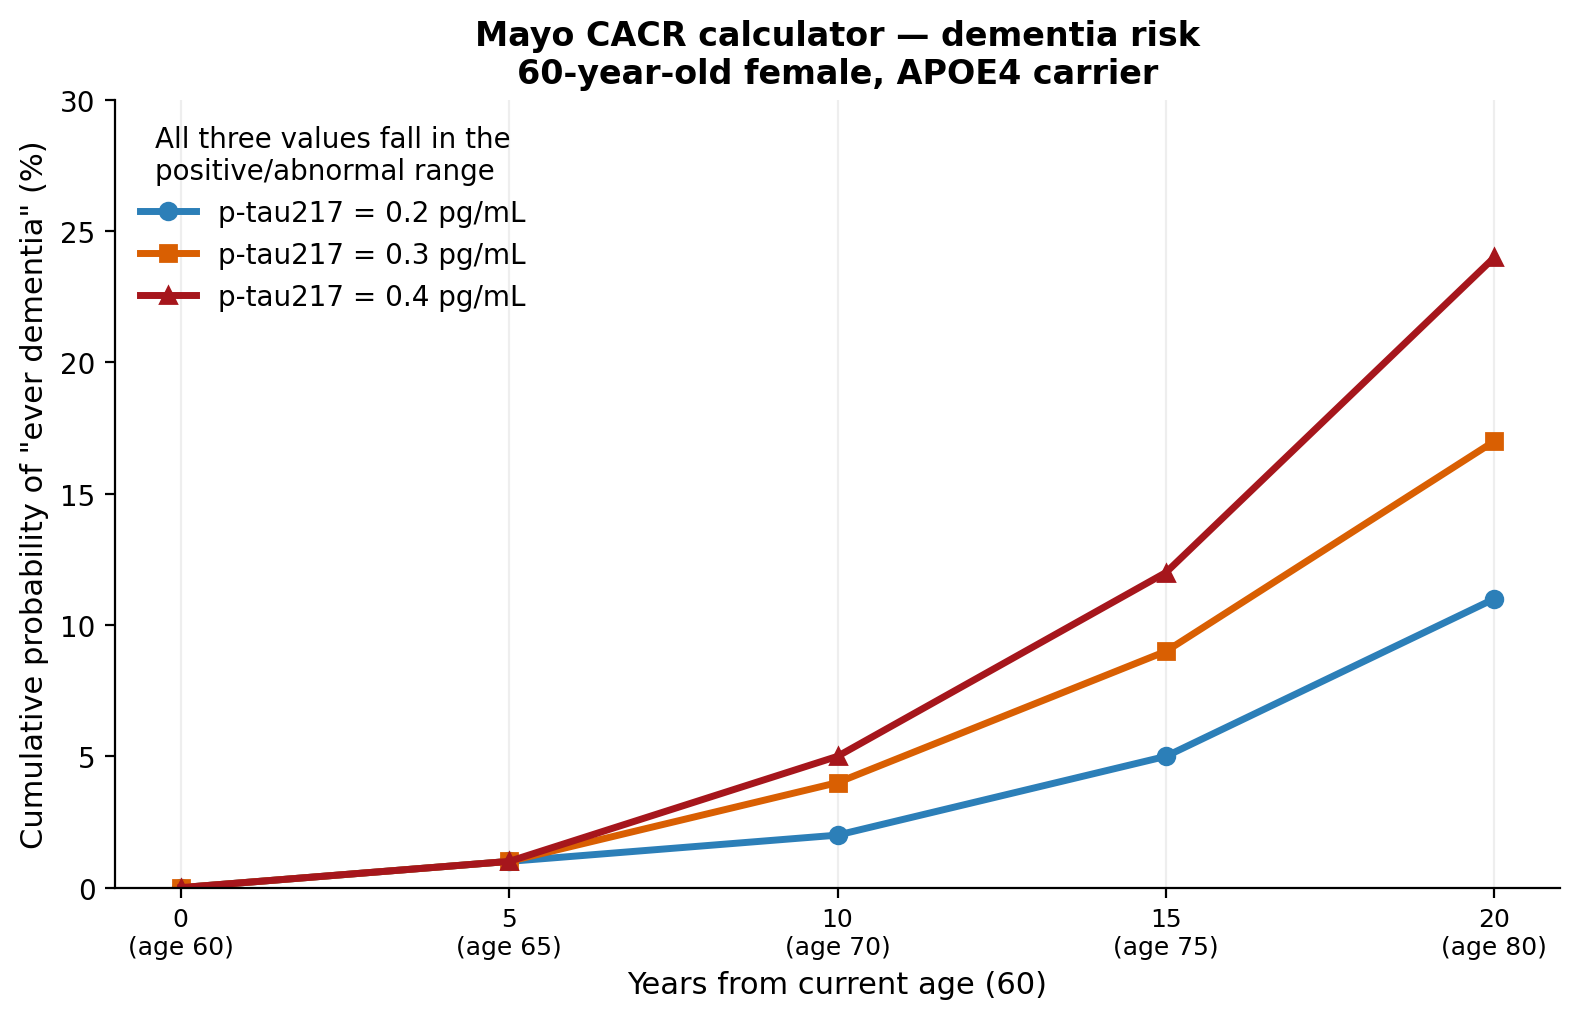
By age 80 (20 years out) p-tau217 0.2 p-tau217 0.3 p-tau217 0.4 Chance of MCI 26% 34% 40% Chance of dementia 11% 17% 24%
Even within this one “positive” range, risk more than doubles. That’s the main lesson: a positive result isn’t one fixed risk level; it behaves like a sliding scale.
And here’s the projection worth remembering most: even at 0.4 pg/mL, the highest value tested here, the model estimates about three in four people (76%) may not develop dementia within 20 years. This example is not exactly representative; it is based on cognitively normal individuals with AD-level brain amyloid deposition (rare occurrence). This is also a simulation, not an observed outcome, so treat it as a projection rather than a fact about any real person’s future.
Picture 100 women exactly like this one, modeled forward: somewhere between 11 and 24 are projected to develop dementia by their early 80s, and the rest are projected not to, within that stretch of time, though real life includes things this kind of model can’t fully capture, other illnesses, earlier death from unrelated causes, or simply better or worse luck than average. A high biomarker is a real signal. It is not a countdown clock.
A useful way to weigh how important this all is: a classic analysis validating the Framingham risk model found men with the highest total cholesterol (280 mg/dL or above) were about twice as likely to have a coronary heart disease event as men with a more typical level (160–199 mg/dL). That twofold gap is in the same range as the two- to fourfold difference this JAMA study found between its highest and lowest p-tau217 groups. High cholesterol built an entire field of preventive cardiology on a risk difference of that size, and nobody dismisses it as minor. Yet no one calls a high cholesterol reading a diagnosis: most people with high cholesterol never have a heart attack. Both things are true of p-tau217 too. A high result is a real, medically meaningful risk signal, and it still isn’t a prediction about any one person’s future.
Genetics changes the math: the Brain study on APOE4
The APOE4 gene is the strongest common genetic risk factor for Alzheimer’s. A study in Brain, using two independent groups of people (one from ADNI, one from the A4-LEARN study), asked a sharp question: does carrying APOE4 change what a given p-tau217 number means?
The answer split in an interesting way. APOE4 did not make amyloid trigger more p-tau217 release. But it did make a given p-tau217 level more likely to trigger actual tau spread across the brain, and the effect grew with each copy of the gene. Put simply: carrying APOE4 seems to lower the bar for tau pathology to start actively spreading, at the very same blood test number.
Using statistical modeling, the researchers estimated the p-tau217 level marking a 50% chance of that tau-spread milestone: in one group, about 0.62 pg/mL for non-carriers, 0.34 for one copy of APOE4, 0.15 for two copies. A second, independent group confirmed the same pattern using a different lab test, though the specific numbers from different assay brands shouldn’t be compared to each other directly, they’re not on the same scale.
A separate comparison using the Mayo calculator points the same direction:
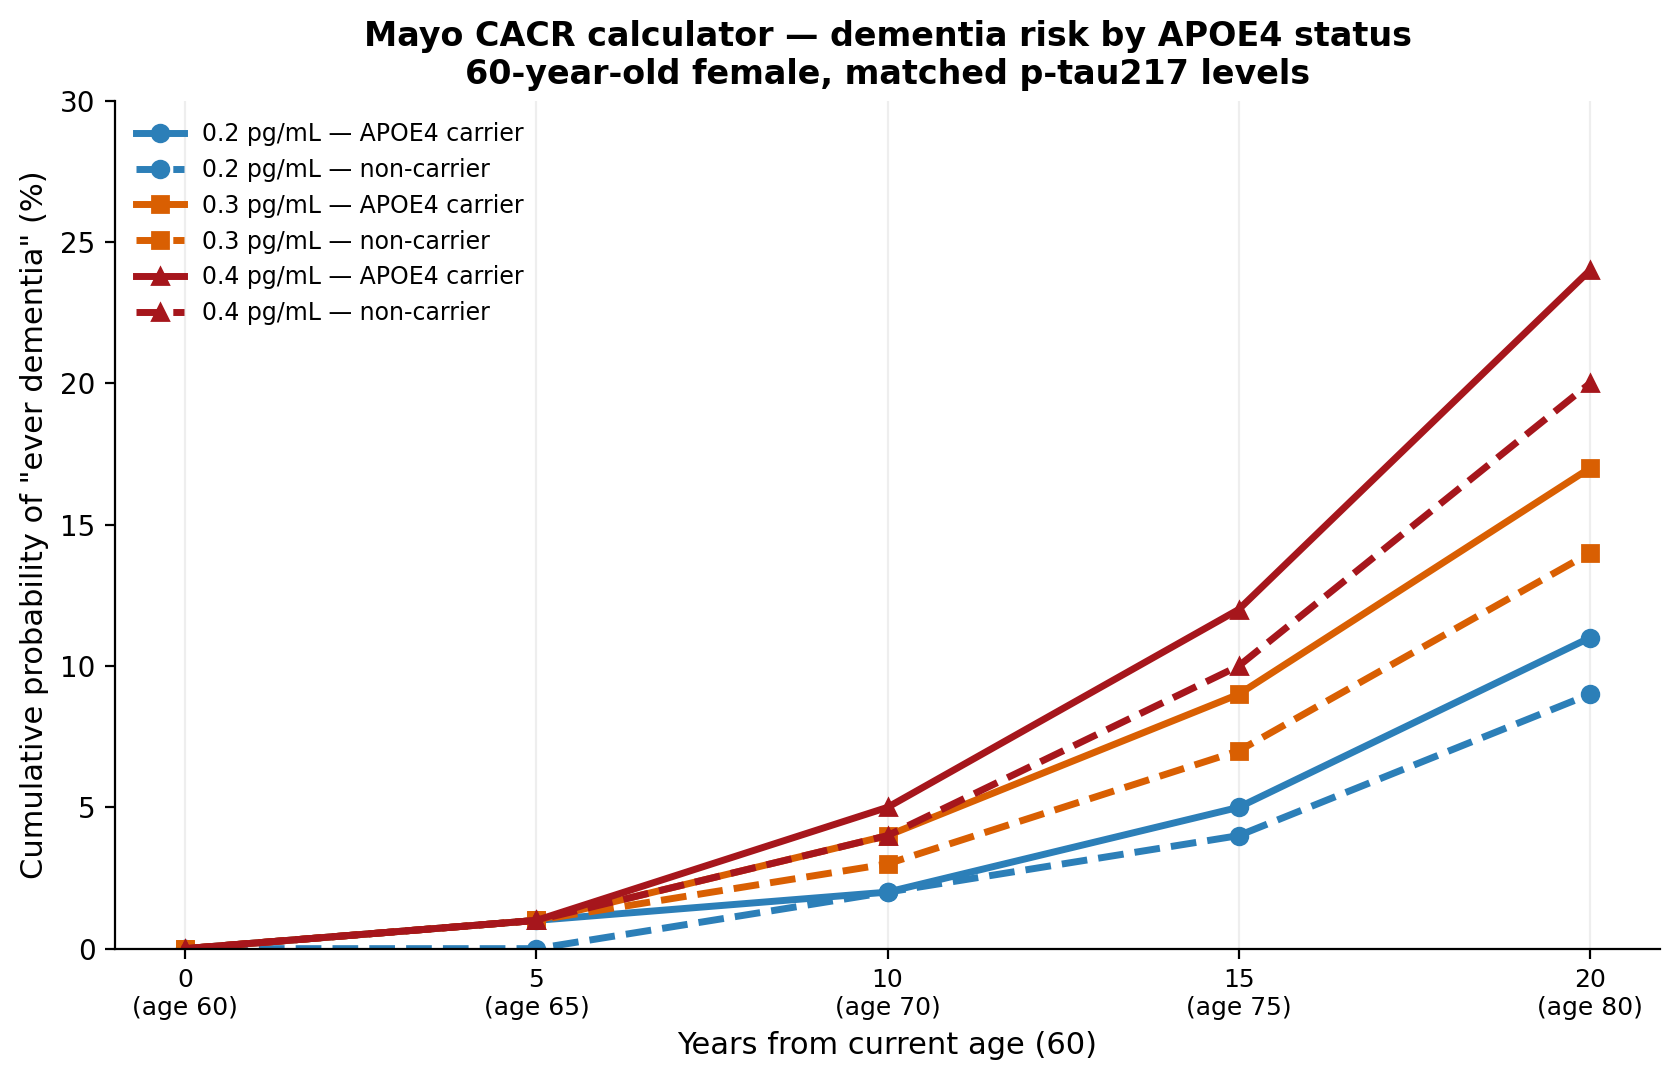
p-tau217 (pg/mL) Carrier: dementia risk by 80 Non-carrier Gap 0.2 11% 9% 2 points 0.3 17% 14% 3 points 0.4 24% 20% 4 points
The gap between carriers and non-carriers widens as p-tau217 rises. That’s consistent with the Brain study’s finding, though this specific comparison comes from a separate tool and isn’t direct proof of the same mechanism.
One nuance worth flagging: does this hold at every level, or only some? The Brain study’s effect was clearer in the group with more advanced disease and murkier in the earlier-stage group, so it’s not yet settled whether the genetic effect is constant from the very earliest biology all the way through, or whether it grows stronger over time. That distinction matters for anyone hoping to use a single p-tau217 cutoff for everyone: the same number may carry meaningfully different risk depending on genotype, and possibly depending on how far along someone already is.
And the thresholds identified for “tau starting to spread” are low in absolute terms, especially for APOE4 carriers, yet the resulting dementia risk, as shown above, still stays fairly modest for years afterward. That’s not a contradiction: crossing that biological threshold marks the quiet start of a process that typically takes additional years to turn into noticeable decline. Think of it as an early warning light coming on in a car with a lot of road left before the engine actually stalls.
Some real limits here too: a key brain region (the hippocampus) had to be excluded from the tau scans for technical reasons, the “spread” maps rely on estimated brain wiring rather than confirmed anatomy, and blood p-tau217 reflects tau leaking out of cells, not the actual tangles forming inside them. The two research groups also used different lab-test brands, so their exact pg/mL cutoff numbers, and the Mayo calculator’s numbers above, shouldn’t be treated as the same scale even where the figures happen to look similar.
What’s coming next: chasing a “goldilocks” window
That gap between early biology and later symptoms is exactly what the newest prevention trials are trying to exploit. The idea: treat people early enough that amyloid is clearly present (worth the risks of a drug) but before tau pathology has spread very far, since once tau is well underway, removing amyloid may not change the trajectory much anymore. Call it a goldilocks window, not too early, not too late.
Three trials are testing this now. TRAILBLAZER-ALZ 3 (donanemab) screened over 63,000 people with plasma p-tau217 to find about 2,200 eligible participants meant to have amyloid with only early tau. AHEAD 3-45 (lecanemab) splits people into two amyloid-level groups, an earlier group with moderate amyloid buildup and a more advanced group with higher amyloid, and uses blood tests mainly to cut down on unnecessary brain scans rather than to gatekeep tau status directly. PrevenTRON, a newly announced trial of a drug called trontinemab, plans to enroll around 1,600 people selected largely by an elevated blood result, with the main goal of measuring time until noticeable decline begins.
Here’s the catch, and it connects right back to the earlier point that p-tau217 partly reflects tau, not just amyloid: using it alone to find “amyloid present, tau still limited” people risks letting some people in who already have more tau than intended. TRAILBLAZER-ALZ 3’s own data show this plainly, roughly 1 in 6 to 1 in 4 of its p-tau217-selected participants already had elevated tau on a brain scan. That’s less a flaw than an unavoidable trade-off: scanning 63,000 brains isn’t realistic, so a blood test is used instead, at some cost to precision.
It’s also worth saying plainly that this whole “goldilocks” idea comes mostly from looking back at subgroups of older trials, not from a trial designed around it from the start. Ideas like that often look weaker, or disappear, once tested directly instead of spotted after the fact. These three trials are a real test of whether the idea holds up.
Research tool, not a clinical test
To repeat the core message: this blood test is not ready for ordering on a healthy person outside of research. Official guidelines recommend against it in routine care, and even the JAMA study’s own authors describe their findings as useful for research and trial design, “not yet precise enough to guide individual prognosis.”
What is a very high p-tau217 good for today? Mainly, identifying good candidates for prevention trials, exactly how it’s used in the trials described above. It is not a trigger for a specific medical decision, because there’s no approved treatment yet that a healthy person’s blood result would unlock. The general advice for someone with a high result, manage vascular risk factors, stay physically and mentally active, sleep well, avoid excess alcohol, is the same advice anyone at elevated risk should already be getting, biomarker or not. Being “eligible for a trial” and “needing a different care plan” are not the same thing, and it’s easy to blur the two. Larger, more representative studies, and clearer genetics- and lab-specific calibration, are still needed before that changes.
Take-home messages
A very high p-tau217 result is a genuinely important finding. It meaningfully raises the odds of future cognitive decline in a healthy older adult, comparable in scale to how a marker like high cholesterol raises heart disease risk.
Important is not the same as certain. Most people, even in the highest-risk group, do not progress within the years these studies could follow. A strong signal shifts the odds; it doesn’t decide any one person’s fate.
There’s no universal cutoff yet. Different labs and assays define “positive” differently, largely because those cutoffs were built for diagnosing symptomatic patients, not screening healthy ones.
A blood result never replaces a clinical evaluation, whatever the number says.
Genetics changes what a given number means. Carrying APOE4 appears to shift the biology, so the same result may not carry the same meaning for everyone.
Long-range projections are models, not facts. Multi-decade risk curves are useful for intuition, not for predicting any individual’s future.
New prevention trials are testing an appealing but unproven idea: treating people early enough to matter, before too much tau has spread. Whether that strategy actually works is still an open question.
This is a research tool, not a clinical test. Current guidelines recommend against using it to screen healthy people outside of research studies and trials.
References
Buckley RF, Townsend DL, Birkenbihl CJ, et al. Prognostic value of blood-based p-tau217 levels for progression to cognitive impairment. JAMA. Published online July 14, 2026. doi:10.1001/jama.2026.12556
Sperling RA, Donohue M, Rissman R, et al. Amyloid and tau prediction of cognitive and functional decline in unimpaired older individuals: longitudinal data from the A4 and LEARN studies. J Prev Alzheimers Dis. 2024;11(4):802-813.
Jack CR Jr, Hu M, Wiste HJ, et al. Lifetime and 10-year absolute risk of cognitive impairment in relation to amyloid PET severity: a retrospective, longitudinal cohort study. Lancet Neurol. 2025;24(12):1016-1025.
Mayo Clinic Study of Aging. CACR p-tau217 calculator (Fujirebio Lumipulse Research Use Only assay, version 2). Available at: rtools.mayo.edu/CACR. Accessed July 2026.
Steward A, Dewenter A, Hirsch F, et al. ApoE4 lowers the ptau217 threshold for tau aggregation and spread in an allele dose-dependent manner. Brain. 2026;149(6):1902-1914. doi:10.1093/brain/awaf463
Palmqvist S, Whitson HE, Allen LA, et al. Alzheimer’s Association Clinical Practice Guideline on the use of blood-based biomarkers in the diagnostic workup of suspected Alzheimer’s disease within specialized care settings. Alzheimers Dement. 2025;21(7):e70535.
Yaari R, Holdridge KC, Williamson M, et al. Donanemab in preclinical Alzheimer’s disease: screening and baseline data from TRAILBLAZER-ALZ 3. Alzheimers Dement. 2025;21(9):e70662. doi:10.1002/alz.70662
Rafii MS, Sperling RA, Donohue MC, et al. The AHEAD 3-45 study: design of a prevention trial for Alzheimer’s disease. Alzheimers Dement. 2023;19(4):1227-1233. doi:10.1002/alz.12748
Roche/Genentech. PrevenTRON: rationale and design of a Phase III trial of trontinemab in cognitively unimpaired individuals with biomarkers of Alzheimer’s disease at high risk of clinical decline. Presented at the Alzheimer’s Association International Conference (AAIC), London, July 2026.
Gander J, Sui X, Hazlett LJ, Cai B, Hébert JR, Blair SN. Factors related to coronary heart disease risk among men: validation of the Framingham Risk Score. Prev Chronic Dis. 2014;11:E140. doi:10.5888/pcd11.140045
This is a fascinating discussion as p-tau217 illustrates both the promise and the complexity of biomarker-driven medicine. The ability to detect Alzheimer’s disease–related pathology through a blood-based biomarker could fundamentally change how we approach diagnosis and potentially earlier intervention.
At the same time, the idea of a “Goldilocks” range highlights an important challenge: biomarkers are rarely binary indicators of health versus disease. Their interpretation depends on the biological context, timing, assay characteristics, and most importantly, the clinical question we are trying to answer.
As a physician-scientist, I think the real opportunity is to move beyond asking whether a biomarker is “positive” or “negative.” It’s important for us to understand what a given level means for an individual’s risk, trajectory, and potential treatment response. The future of precision medicine may depend not only on detecting pathology earlier, but on learning how to interpret these signals longitudinally, tracking change over time rather than relying on a single snapshot.
Thank you!
Wife, 64, receiving maintenance ECT for bipolar depression. High p-tau217. Can ECT transiently increase p-tau217? Only 1 PubMed article with small cohort. Suggests yes: ECT can increase p-tau217.